If you have a website or are looking to make one, or even if your an avid Google apps user, you have probably heard about Google Analytics. Google Analytics is a free tool that you can have running on your website that tracks all of your visitor information and then reports on it for you in whatever format you want. Setting it up is easy but utilizing everything the program has to offer is a little more difficult. All of the reports I explain below and more all have the ability to be emailed at any time frame to any email of your choice. In order to get a Google analytics account you will need your own Google account either in gmail form or business app form (@yourbusinessname.ca). Your third option is to get a third part to setup your Google Analytics and have the reports emailed to you weekly etc. Your most basic report that the system can spit out is a weekly visitor overview (now called audience overview) which will tell you how many people visited your site the previous week, where did they go on your site and where they were from. See picture below:  It doesn’t stop there. If you want a greater detailed report or want to hone in on specific traits of your visitors such as which province or state they live in or which device or browser they used to look at your site, its all available through the program.
 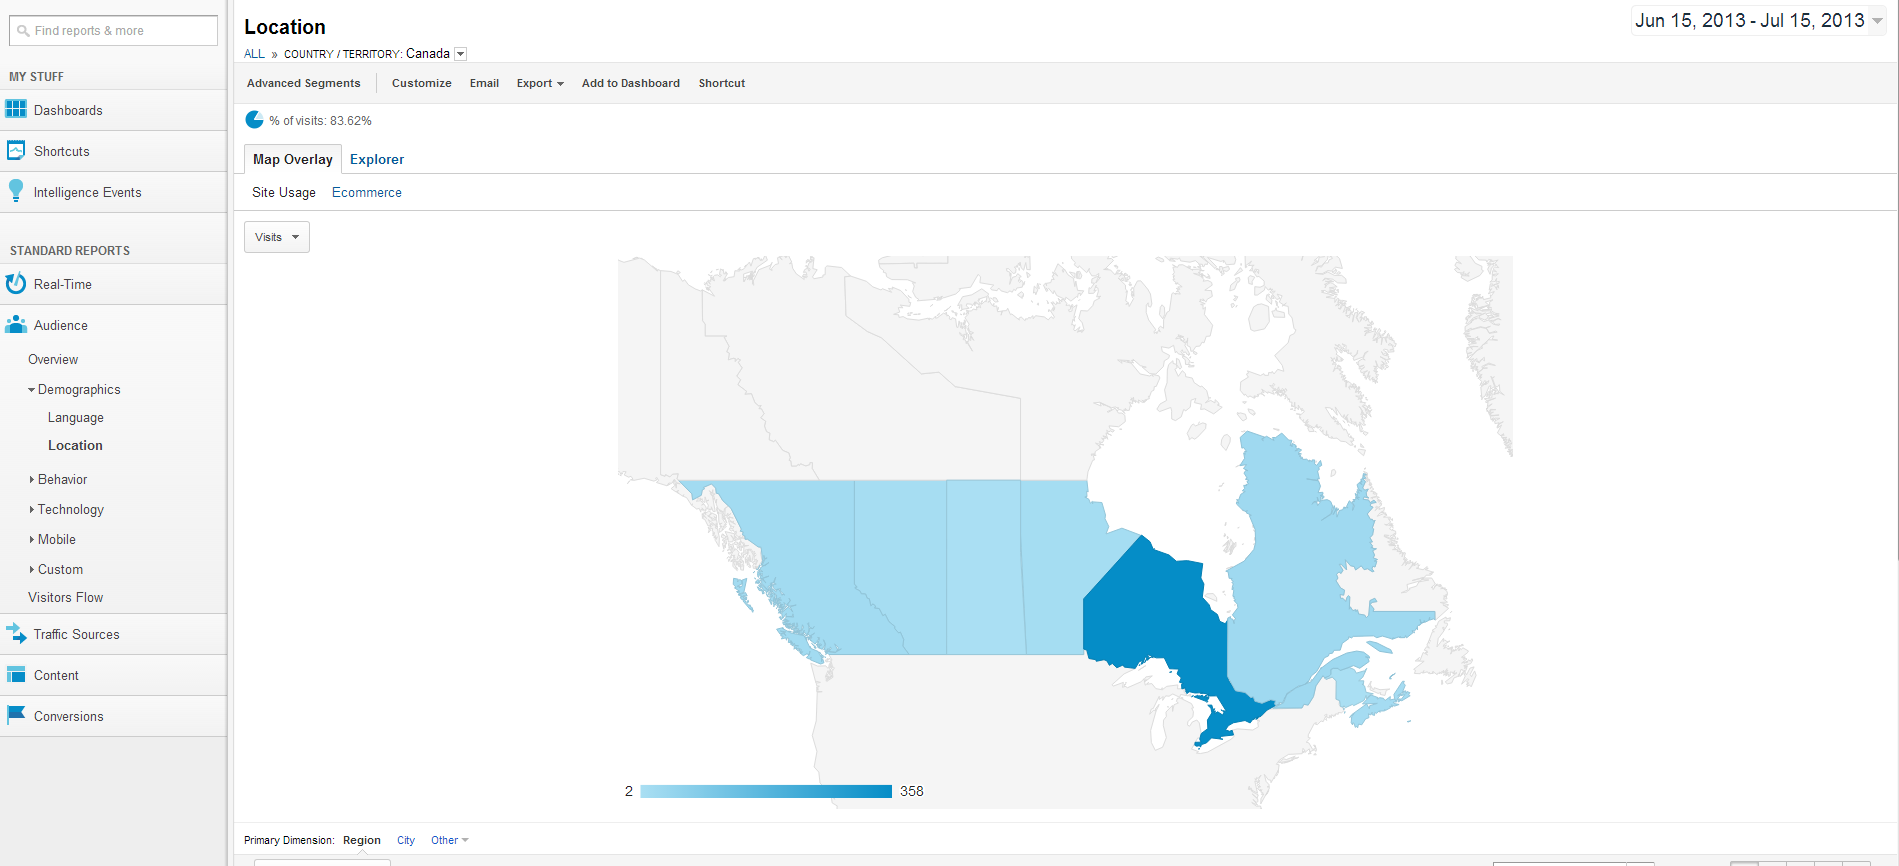 Want to see where all your visitors are coming from? Traffic flow is another category which breaks down your visitors into 4 different categories: Search Traffic, Referral Traffic, Direct Traffic and Campaign Traffic. Search Traffic is straight forward, like the others, its from people who searched for something and then clicked on your site from there Referral Traffic is when someone clicks on your link from someone else’s site. (Example your banner or link on your friends/ business partners page, if someone clicks on it, that is referral traffic) Direct Traffic is someone going to their browsers address bar and typing www.mywebsite.com Campaign Traffic is traffic that is being directed to your site through Google ad words or other PPC service.
 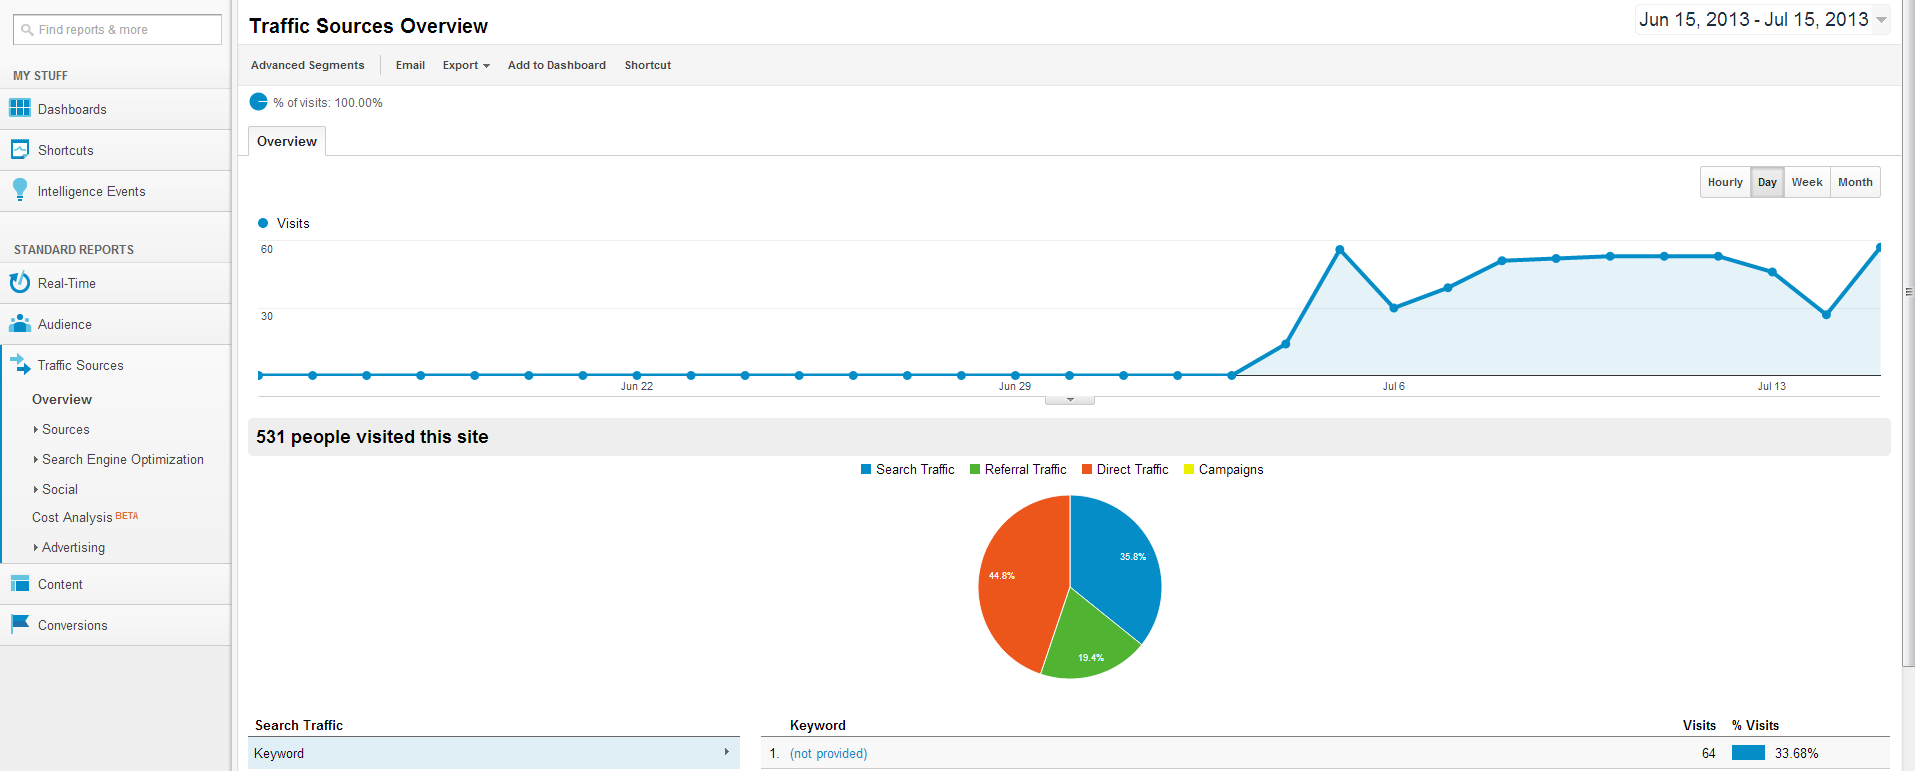 Content reports are another section of google analytics that shows what pages were visited and at what times. You can see specific behaviour flows as well to see how your visitors went to each page and the path they took and where they dropped off the most. This kind of data is useful for traffic shaping to see where your visitors are leaving, and then altering that page so that they are moving on to other content to get them to stay on your site longer and eventually convert from an opportunity to a sale.
  All these reports are great but there is one more piece of functionality to show off (there are many more I am not going to cover) the Dashboard. If you don’t want to view each report separate and you want a one stop shop of all of your information / data then a dashboard customized to your information you want to see is for you. It is basically a widget based explorer of any data type explained above and can be your default landing for reporting when you visit your analytics profile. Are you ready to get your analytics report setup for your website? If you need any help getting it up and running, you can count on us to help you out! Contact us today